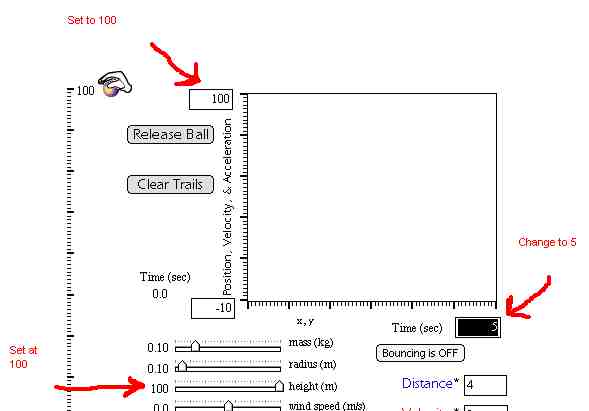
2. Find the box at the end of the x - axis that reads 4. Change the number to 5.
3. Set the slider for mass ( kg ) to .1 kg
4. Set the slider for height to 100 meters
Introduction
When an object is in freefall, it will accelerate at the rate of 9.8
m/s2. Every object has a maximum
velocity it will reach during free fall, called the terminal velocity.
Once the object reaches terminal velocity, its speed will not change any
more. In this lab, we will examine how the mass of an object affects the
time needed to achieve terminal velocity.
Information
We will be using a freefall simulation at Explore
Science.com
Activity:
1. Find the box at the top of the y-axis that reads 20. Change the number
to 100.
2. Find the box at the end of the x - axis that reads 4. Change the
number to 5.
3. Set the slider for mass ( kg ) to .1 kg
4. Set the slider for height to 100 meters
5. Click on Release Ball
6. The ball will drop while data for distance, velocity, and acceleration
is graphed.
7. Examine the graph after the ball hits the ground. Look at the red
line. This line is the velocity. If terminal velocity was reached, the
line should become horizontal.
8. If terminal velocity was reached, you need to determine the amount
of time it took for the terminal velocity to be reached in freefall.
9. Move the mouse to your graph. A crosshair should appear.
10. Position the crosshair on the red line for velocity at the point
where the velocity did not change ( started to move horizontal )
11. The time (in seconds) is given by the first number under the x-axis.
See example.
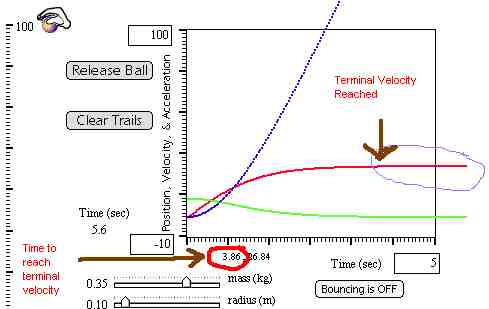
12. Record the time in your data chart for the mass tested.
13. Click on the button Clear Trails.
14. Change the slider for mass to the next one given in your data table.
15. Repeat # 5-14 for all masses listed in your data chart.
Data Chart:
|
|
|
|
|
|
|
|
|
|
|
|
|
|
|
|
|
|
|
|
|
|
|
|
|
|
|
|
|
Analysis: Using Microsoft Excel,
create a line graph to compare the mass and time needed to reach terminal
velocity. In this graph, mass is the independent variable. Be sure to include
all labels and include your name with the title of the graph.