Dropin 3 - This activity should contain all the elements of 1 and 2 and should include the interpretation of a chart, graph, map, data set, or other graphic representation of information. (example)
Introduction
Recently, we beagn exploring biomes around the world. Biomes are ecosytems
with a particular climate and vegetation. Biomes will appear in several
locations around the world with similair characteristics. A desert in North
America will be very similair to a desert in Africa. Climate is the main
factor that is shared by two different locations that are classified as
the same biome. Climate is the average weather over a period of time, usually
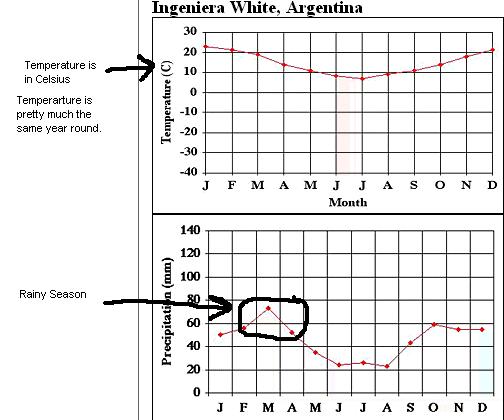
a year. A climatogram is a special graph that displays information about
temperature and precipitation at the same time. Here is an example of a
climatogram below:
In this assignment, you will explore information and pictures about biomes around the world. try to focus on the information about the climate of the biome. After the exploration stage, you will embark on a mission to match climatograms with biomes.
Information
The website we will be using is from NASA, titled Earth
Observatory. Once you click on the link and reach the main page, visit
each of the biomes from the begining page. Fill in your data chart as you
visit each biome. Try to focus on the patterns that occur with the climate.
Does the biome have 4 distinct seasons? (indicated by temperature) Does
the biome stay at the same temperature year round? Is there a rainy season?
Does the biome recieve a little or a lot of precipitation? Once you are
done with your data chart, return to the begining page and click on Graphing
Mission. Select the advanced user level.
Activity
1. Examine the links to the different biomes. Fill in your data sheet as you visit each biome.
2. Return to the starting page. Click on Graphing Mission. Select the advanced user level.
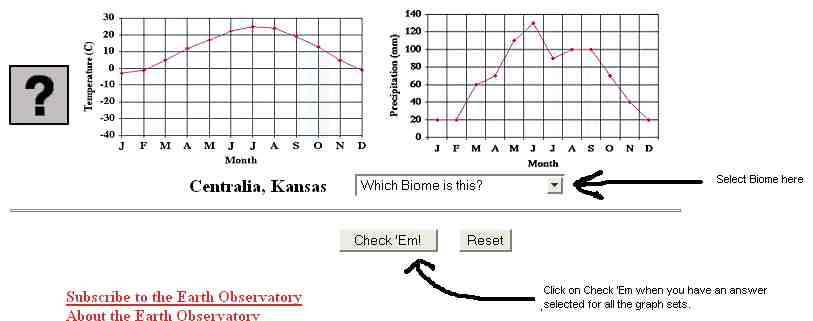
3. Your objective in the mission is to match each
climatogram with the corect biome. Examine the climatograms and compare
to your dta charts on the biomes.
Select the biome from the
drop down box next to each climatogram.
4. When you have an answer for each city, click on
the button Check 'em. Any that are incorrect will have a red X next to
them. Select again until you have
them all correct..
Questions - fill in the data chart
as you visit each biome. (paper copy provided to students)
| Biome | Temp. hot or cold?
note : 21oC = 70o F |
Temperature Pattern? | A little or a lot of Precipitation? | Precipitation Pattern? |
| coniferous forests | ||||
| temperate deciduous forests | ||||
| deserts | ||||
| grasslands | ||||
| rainforests | ||||
| shrublands | ||||
| tundras |