Created by:
Erik Heinemann
for Chemistry Students
Purpose:
- To learn how to use graph paper, and computer programs in order to create graphs efficiently for the lab notebooks and other assignments.
- To identify trends on the Periodic Table by constructing graphs to correspond with the trends
Task:
In this activity you will be asked to create several graphs using Microsoft Excel and at least one by hand. Often times in class or at home the computers are available for you, but sometimes (especially during tests) you have to draw graphs by hand. It is important that you know how to do both.
Assignment:
You will create graphs using Microsoft Excel and print them for your teacher. You will also have to complete one graph on graph paper to be submitted with the printed graphs. For each of the graphs there will be some questions that will need to be answered.
Scoring:
Computer graphs are worth 5 points each, the hand drawn graph is worth 10 and each question is worth 2 points.
Instructions:
Read through the following notes on hand drawn and Excel graphing and create the graphs as instructed in the "Activity" section below. You may print the notes if you wish so that you may use them as a reference later.
Notes:
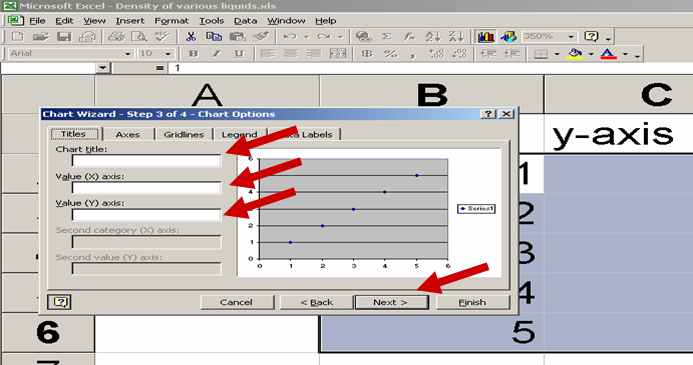
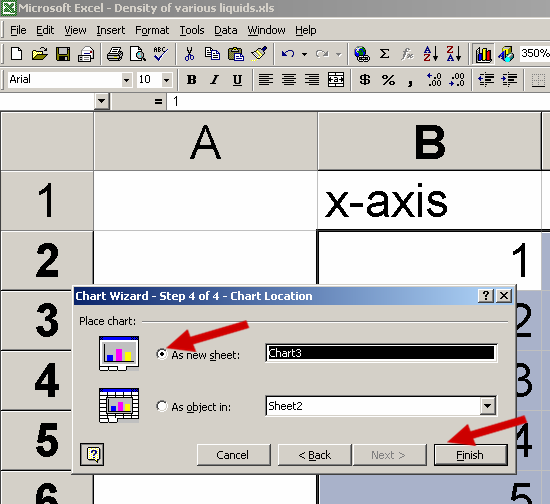
In order to ensure that ¾ of the graph space is used, follow these steps:
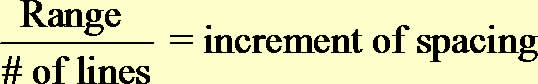
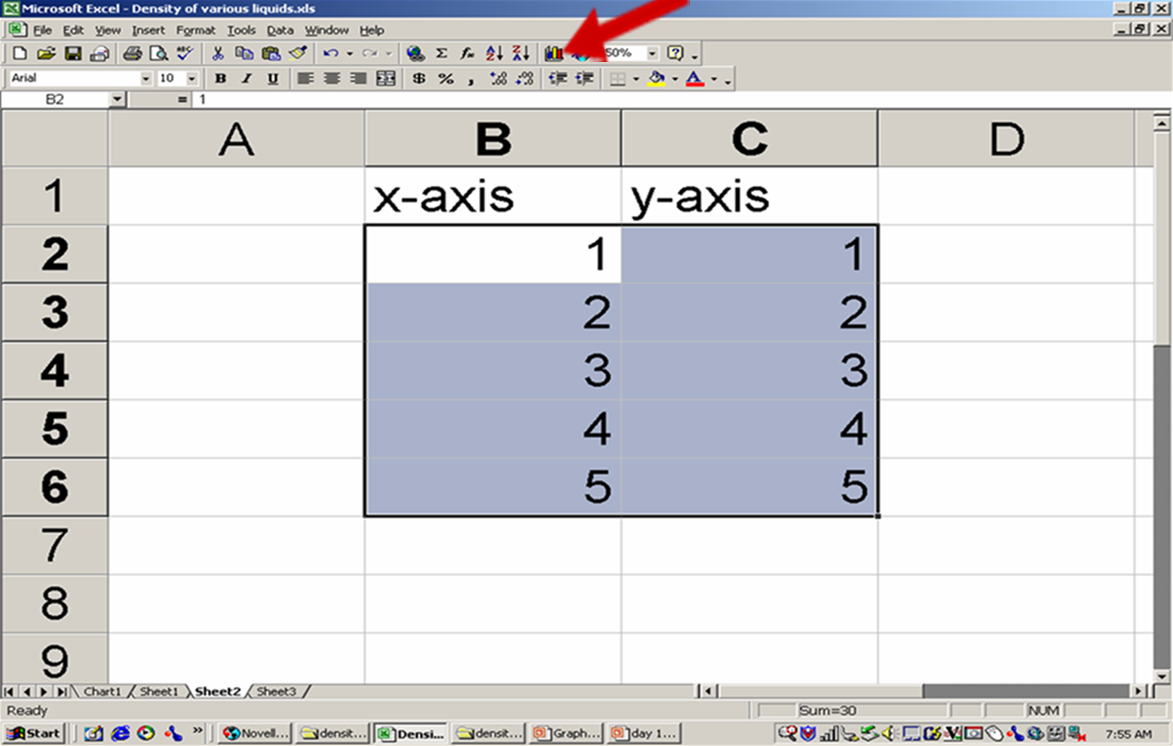
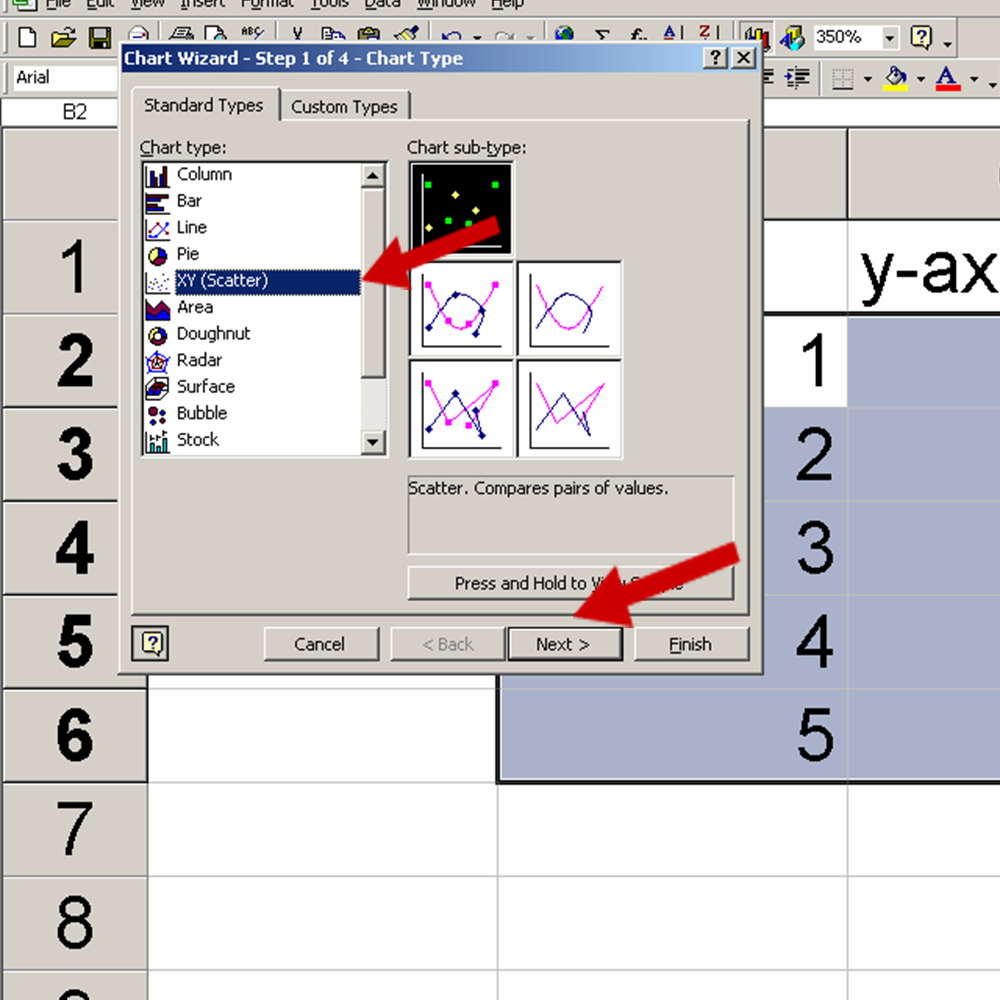
See the Red Arrows in the picture below for help:
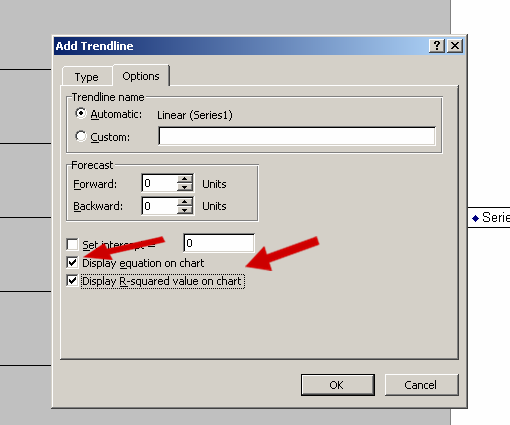
See the picture below for the trendline commands:
Click on the following link to get the PowerPoint version of the notes above so that it is more printer friendly. The printable version uses FlashPaper and may require you to allow pop-ups.
![]()
Activity:
You may copy and paste this section or click to get a printer friendly section copy of the following information.
Name _________________________________ Period _________ Date _______________________
Student outcome: The student will graph and explain the trends found on the Periodic Table.
Problem: Are certain properties of elements periodic of their atomic numbers?
Materials: graph paper, computer with Microsoft Excel, possibly colored pencils.
Procedures:
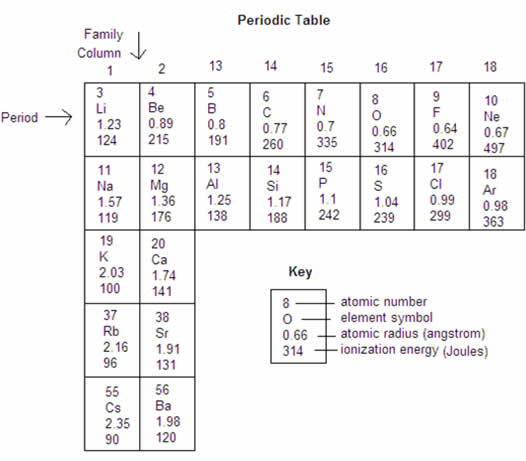
In this activity you will be making 4 graphs. The first will be done on graph paper (hand drawn) while the rest will be done using Excel. Each graph will use the data found in the section of the Periodic Table that is found below. Trendlines are not necessary for these graphs, but you should connect the data points with lines.
To connect the cata coints with a continuous line:
Graph 1: For elements 3-20, use the data below to graph atomic radius as a function of atomic number. Plot atomic number on the X-axis (as it will throughout the activity on all of the graphs) and atomic radius on the Y-axis. Be sure to properly space the graph and label all aspects accordingly. This one is to be done on graph paper (provided to you in class).
Graph 2: Use Excel to create and print a graph of atomic radius as a function of atomic number for the elements in Column 1 on the table.
Follow the directions below to add a second line for Column 2 from the table.
Special notes on how to add data to existing graph:
Graph 3: For elements 3-20, use Excel to create and print a graph of the energy required to remove the easiest electron (ionization energy) as a function of atomic number.
Graph 4: Use Excel to plot and print a graph of ionization energy as a function of atomic number for the elements in Column 1 of the table.
Repeat the procedure above to include a second line for the elements in Column 2.
Observations:
1.
|
What happens to the atomic radius as the atomic number increases across a period? Down a family?
|
2.
|
What happens to the energy needed to remove an electron as the atomic number increases across a period? Down a family?
|
Conclusions: Use your text or notes from class to answer the following questions.
1.
|
Are these properties of the elements periodic functions of their atomic number? Why or why not?
|
2.
|
Why does atomic radius change as it does?
|
3.
|
Why does energy required to remove an electron change as it does?
|