BAR GRAPH DIRECTIONS
Bar
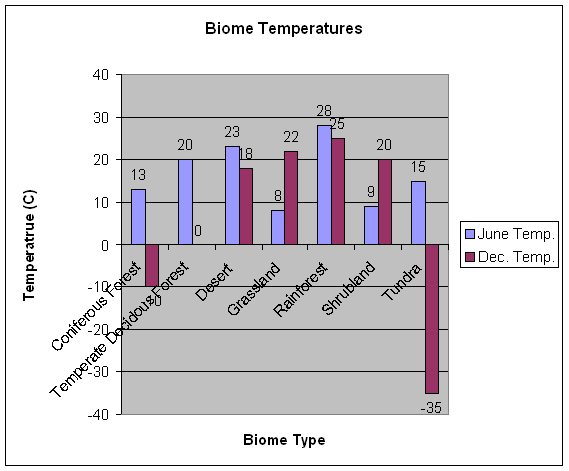
Graph #1 - Temperature
·
Review
the graphs of each of the biomes and determine what the average temperature is
for January and July is in each biome.
·
Place
the temperature on the Y axis.
·
Place
the biome name on the X axis.
·
Enter
the data and color in your bars.
Example:
Bar
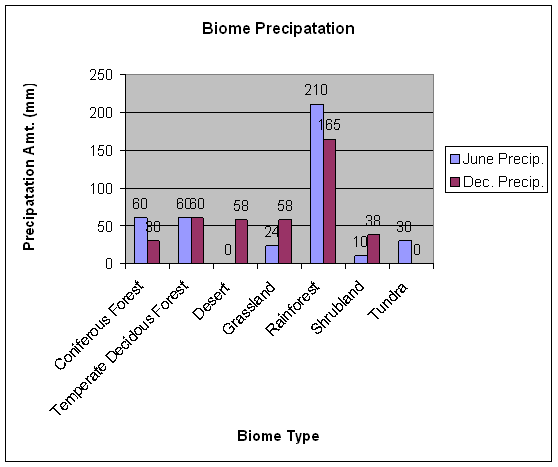
Graph #2 – Precipitation
·
Review
the graphs of each of the biomes and determine what the average precipitation
is for January and July is in each biome.
·
Place
the precipitation amount on the Y axis.
·
Place
the biome name on the X axis.
·
Enter
the data and color in your bars.
Example: