Brandy
Burns
SLM521
Drop
In #5
Go For the Gold!
Because it is an Olympic year, we will
be graphing the amount of gold medals the
Part One: Years of the Olympics
Use the chart below to organize your
information.
|
Olympic Years |
|
|
|
|
1988 |
|
|
|
|
1992 |
|
|
|
|
1996 |
|
|
|
|
2000 |
|
|
|
|
2004 |
|
|
|
|
2008 |
|
|
|
Part Two: Find the Numbers
Click on the years below to find the
information to fill in the chart above. You
will be analyzing several bar graphs. The
links below list all of the countries that participated in each Olympic
Games. However, remember to search for
the 3 countries we're discussing.
|
Locate the
number of gold medals won by the |
|
|
Locate the
number of gold medals won by the |
|
|
Locate the
number of gold medals won by the |
|
|
Locate the
number of gold medals won by the |
|
|
Locate the
number of gold medals won by the |
|
|
Locate the
number of gold medals won by the |
Part
Three: Create!
Create a bar
graph of the information you have recorded in the chart above.
Use this key
for your graph:
Blue for
Red for
Black for
Remember to
include:
o
Title
o
Labeled
x and y axis
o
Appropriate
values for the x and y axis
(image
from http://designcoalition.org/kids/energyhouse/graphs/blank.GIF)
Part
Four: Putting It All Together
….Answer the
following questions.
o
What
country of the three has won the most gold medals from 1988-2008?
o
Why
do you think this is?
o
How
did the bar graph help you figure it out?
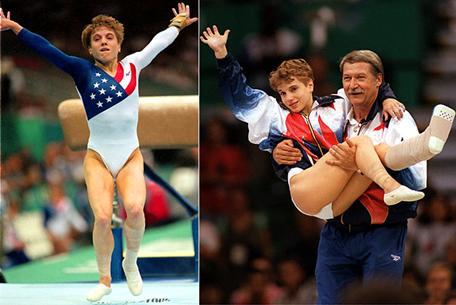
Part
Five: Using your
internet searching abilities, find a graphic to represent something interesting
to share with the class about the Olympics you learned today, or already like
about the Olympics. My example is Kerri Strug from the 96 Women's Gymnastics team because she
displayed strength and courage on her last vault, taking her team to a Gold
Medal VICTORY!
Be ready
tomorrow with your graph completed, your graphic chosen, and ready to discuss
your findings in class!