Organize
Data into Graphs
Objective: Students
will be able to collect, organize, and
display data into a tally chart
then into a
bar,
line, or picture graph.
Launch: Student
will view the following web sites for
explanation of different types of graphs.
http://www.mste.uiuc.edu/courses/ci330ms/youtsey/intro.html
http://homepage.mac.com/dpsdescartes/worksheets/stat4.pdf
Procedure #1:
Students are to take a
survey of 15 people to find out their favorite school lunch from the provided
list: (hotdog, hamburger, pizza, chicken, or tacos)

![]()


![]()
Students will tally the
results of their survey and create a tally chart for their data.
View the website below for
explanation on how to create a tally chart.
http://www.blacksacademy.co.uk/data/MAPCTC10.pdf
(Tally chart provided on next page )
|
Kind of food |
Tally Mark |
Total Number |
|
Hot Dog |
|
|
|
Hamburger |
|
|
|
Pizza |
|
|
|
Chicken |
|
|
|
Taco |
|
|
Procedure #2:
Students will create a
single bar, line, or pictograph
using the collected data.
Use graph paper to create your
graph. (See examples
below)
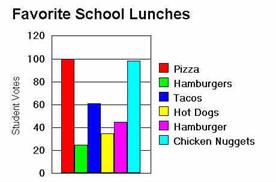
Bar Graph
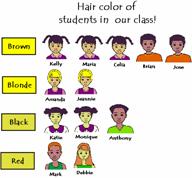
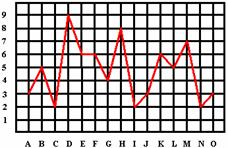
Pictograph GrAph Line graph
Assessment: Instructor
will assess the accuracy of
student’s tally chart and graph.