|
Transformations of Functions |
|
|
|
The graphing calculator is a powerful tool to use in analyzing functions. For those students who do not own a graphing calculator, there are utilities available on the internet to graph functions. Graph sketcher is one such utility. |
|
|
|
In
the following lesson we will be studying transformations of functions. A function is transformed ( “stretched” or
“squashed” moved left or right) by changing the coefficient of x or adding / subtracting
a constant value. By using the
sketcher utility and the following worksheet you will discover how functions
are effected by changing the coefficient of x or adding or subtracting a
constant value. Click here
to explore transformations using sketcher.
Use the following worksheet to guide your exploration. |
|
|
|
Note:
x**2 is equivalent to x squared. |
|
** is giving the base x in this
case the power of 2. |
|
|
|
A single * represents
multiplication |
|
Graph Sketcher Worksheet |
|
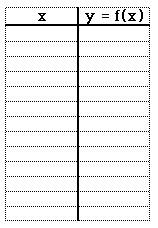
Have handy paper, pencil and a calculator. For each exploration, build a chart like: |
|
|
|
Choose the list of x values (-5, -4, -3, -2, -1, 0, 1, 2, 3, 4, 5 might be a good list) and then calculate the corresponding y values. Use this chart to fill in the points to be plotted in simpleplot. To do the explorations below, be sure to calculate many points (10 or more). |
|
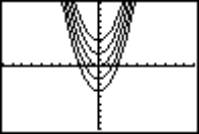
Exploration 1: Up and Down Choose any function, for example, x**2. Now graph, on the same picture, x**2+1, x**2 +2, x**2+3, x**2-5, and so on (take the same function and add or subtract different numbers). What happens to the graphs? Why? Try it with several different functions. What is different? What is the same? |
|
Exploration 2: Left and Right Choose any function, for example, x**2. Using different numbers, substitute (x+number) or (x-number) for x in the function formula. Graph several such functions on the same picture, for example, x**2, (x-1)**2, (x+4)**2. What happens? Why? Try it with several different functions. What is different? What is the same? |
|
Exploration 3: Stretch-1 Choose any function, for example, x**2. On the same picture, graph the original function and the function multiplied by different numbers, for example, 3*(x**2), -5*(x**2), .7*(x**2), and so on. What do you see? Why does it happen? Try it with several different functions. What is different? What is the same? |
|
Exploration 4: Stretch-2 Choose any function, for example, x**2. Using different numbers, substitute (x*number) for x in the function formula. Graph several such functions on the same picture, for example, (x*3)**2, (x*5)**2, (x*.1)**2 What do you see? Why does it happen? Try it with several different functions. What is different? What is the same? |
|
|
|
Exploration 5: Combine! Choose a function, for example, x**2, and do all or some of the things from the above to it, for example, (2*x+3)**2-5. First graph only the original function and try to predict how the modified function will look like. Then graph both the original and the modified function on the same picture, and see if you predicted the shape correctly. Try to do modifications in a different order (e.g., 2*x+3)**2-5 and (2*(x+3))**2-5). Does it make a difference? Why? Now do it for several different functions. |
Copied from: http://www.shodor.org/interactivate/activities/sketcher/worksheet.html