Cynthia Vaskis
SLM521 – Spring 2004
Dropin #5 Assignment
4/13/04
File: dropin5.htm
How Math is used in
Computer Image Generator (CIG) Simulation to Generate CIG Object Models
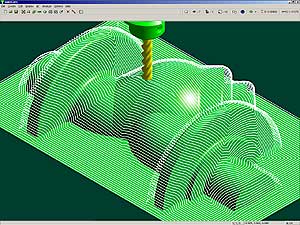
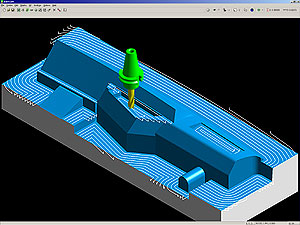
(Click to see wire-frame
CAD/CAM drawings.)
Picture
of CAD/CAM drawing1 Picture
of CAD/CAM drawing2 Picture
of CAD/CAM drawing3
Who is this lesson for and what
background is required?
This lesson is geared toward
senior high school students (11th through 12th grades)
who have had some exposure to 3D Cartesian coordinate systems and Polar
coordinates as described in previous Drop-in 1 and
understand some basic trigonometry as discussed with rotational matrices in Drop-in 2.
Introduction - Computer Image
Generators (CIGs) Use Math to Define the CIG Environment and their Objects in
Three Dimensional (3D) Space
Computer Image Generators create
the images in simulators that are used to train military personnel for
battle. Some simulators are tanks and
some are aircraft in support of ground tank crews. The aircraft are usually ground support
fighters or helicopters. A tank
simulator is a fabricated almost life-size tank-shaped shell containing all of
the functions used by a tank crew during battle maneuvers. There are switches and a turret loading
compartment, turret steering and firing controls, commander radio controls and
a separate driver compartment with steering and speed controls. A tank crew consists of a commander who is in
charge of the driver, the missile loader, and the gunner. Pretend ammunition is loaded by the loader
crew member and then fired by the gunner crew member. The driver crew member takes directions from
the commander crew member via radio for where to drive and how fast. See the CIG
Simulator Steel Beasts web site.
The simulation is played
with two groups of tank simulators pitted one group against another in
battle. An individual tank simulator
commander communicates with other commanders in his” friendly” group of tank
simulators via radio just as it would happen in real life. The “enemy” group of tank simulators can also
hear any communications between the “friendly” commanders. If a (pretend computer model) missile fired
by a tank hits another tank (hopefully, an enemy tank) and does damage to the
tank, then that tank’s simulator controls may stop working and they will not be
able to move across the land. That tank
is considered dead because in real life the people probably would be dead. Then the simulator unit’s computer has to be
rebooted to get back into the simulation if required. The simulators are on a network so that every
simulator can respond to everyone else’s in battle. They all see the same set of tank models on
the land, they all “drive” across the same terrain database and they all react
to any simulator missiles and machine guns fired on their position.
The tank simulators have
computer screens inside that are placed where there would normally be a real
window inside a real tank. The screens
display a view of computerized land which is a huge database model of polygons
created from Digital Terrain Elevation Data (DTED) and colored with texture
maps to make it look like land. The land
database has placed on it any “object models”, such as a tank, tree, house,
person, or anything else used for the simulation. If these “object models” are within the
viewpoint angle for that computer “window” in the tank, then those “objects”
are also seen in the tank’s “window” (really a computer display screen). This allows the driver crew member to drive
around objects placed on the terrain land and the gunner crew member to shoot
at other tanks that are seen in the gunner’s window. The same technique used to create the CIG
land and CIG objects is used to create the background and models in many
computer games that are played on home computers today.
Purpose – To design your own “object
model” (tank, aircraft, person, robot) that could be placed on a CIG
simulation’s terrain database
The purpose of this Drop-in
5 activity is in two parts. The first
part is for the student to understand how math models create CIG simulator
“worlds” used in military training simulators.
This knowledge will be used by the student to complete the second part
which is to have the student design an “object model” that could be placed on
the CIG terrain database. In the real
world, CIG companies use 3D scanners to scan a small toy model of a tank, or
vehicle, for a set of 3D points that model the shape of the object. The computer enlarges the data set to make it
an appropriate size when placed on the CIG simulation’s terrain database. The objects and terrain data are used in a
CIG simulation with people inside simulators viewing this terrain land and
objects through computer screen “windows”.
The terrain database is a math model consisting of a huge set of
polygons. The object models are also a
set of polygons that approximate the shape of the original toy model that was
scanned or the object is generated by a person creating it with a CAD/CAM
drawing routine which saves the shapes as data points that can be converted to
polygon form.
The Task – To Design a CIG Object
Model
The task is for the student to
create their own CIG model of a mobile object (such as a vehicle, tank, car,
aircraft, person, robot, or any object that is not fixed to the terrain) on graph paper or draw it with the aid of a computerized
drawing program. The student needs to
label any appendages that move or don’t move and specify their appendage origin
location relative to the object’s base model origin location. See this diagram for an explanation of the origin labeling process. An appendage origin is the point (x, y, z)
where it attaches to the main body of the model or where it attaches to another
appendage closer to the main body than their location. “Closer to the main body” means that if you
followed a pathway along the current appendage back toward the main body via
crossing other appendages, the one that the current appendage is attached to
that has less appendage parts to traverse to get to the main body is the one
“closer to the main body”.
View the Web sites listed
under CAD/CAM systems (below) to get
an idea of how objects are drawn as wire
frame models on computers. This same
technique can be used to generate a first cut model of the CIG objects. Eventually, the object’s model data must be represented as a set of polygons
which is usually much simpler than the detailed wire frame models. A good CAD/CAM system should allow the user
(or creator of the object models) a choice about how to save the object’s drawing
data (as polygons instead of line drawings).
The computer programmers at a CIG company may need to create their own “object creation” tool to build the
object models so that the stored model data is compatible with the design of
their Simulator’s polygon processors and terrain database.
After reading the
explanation below, the student should be
able to draw their model and define its moving parts in terms of either
rotation matrices or Polar angles.
The student must understand what was described in Drop-in
1 (coordinate systems) and Drop-in 2 (model
rotations) because they will be asked to think about how each part of their
model should be represented. Each part of the model will either be
represented in Cartesian or Polar coordinates. The model, or appendage on the object’s base
model (main body of the object), will move using a rotational matrix for those
models defined in Cartesian coordinates.
Those base models, or appendages, defined in Polar coordinates shall
rotate using Polar angles but their coordinates must be converted to Cartesian
coordinates before being sent to the polygon processors. Every object and land model must be
represented as polygon point (x, y, z) data in Cartesian coordinates before it
is sent to the polygon processors. The
polygon processors create the “window” image as described in the next section.
How a Terrain Database is Created
Using a Math Model of Cartesian coordinates
A math model is created of
the land, or terrain, using a Cartesian coordinate system by the CIG Company
that makes the Simulation database. The CIG company obtains terrain elevation
data for an area of land and uses it to build their own database of polygons
that represent that land. The terrain is modeled as a large grid of
polygons that have a Cartesian coordinate (x, y, z) for every point of every
polygon in the terrain (land) database.
There are some examples of land data available on the Web (see below
under Terrain Elevation Data Web sites).
Usually, there is a specific
area of the real world where the military want to practice maneuvers so the
real Digital Terrain Elevation Data (DTED) files are obtained and used to
generate the land model, or terrain database, in the form of a huge set of
polygons. The DTED files contain
coordinates in the form of location (latitude and longitude) and elevation
(above or below sea level). These are
converted to an X, Y, and Z coordinate model where X and Y are the horizontal
location components (for latitude and longitude) and the Z coordinate is the
elevation data (the land’s height above or below sea level at that (X,Y)
location).
The math objects and land
(terrain) models are stored as a large set of polygons. The polygon processors use the selected
viewpoint angle to determine which polygons from the complete set of objects
and which part of the terrain database needs to be displayed on the computer
screens (or pretend “windows”) inside the Simulator. The viewpoint angle is determined by which direction
the tank or aircraft Simulator’s “window” is facing over the terrain
database. Before displaying the selected
polygons, the polygon processors crop (truncate) them to fit the computer
screen’s boundaries. Then the final
polygons are colored, or texture maps are applied to them, just before they are
displayed in the Simulator “windows”.
In the late 1980’s, when CIG
systems were just becoming feasible, the display process had to double buffer
the images to the computer screen “windows” in order to avoid “flicker”. The human eye can detect image flicker at
less than 30 images displayed per second.
Today, the graphics speeds are so much faster that this is probably not
an issue any more. See how land data is
shown graphically on the Web today at the sites listed below for Digital
Terrain Elevation Data Sources.
Simulator Models are Defined Using
Math Models in Cartesian or Polar Coordinates
Once the terrain data is
established, the stationary models are defined and placed on the land
database. Each model must have an origin
location that is defined as (x, y, z) = (0, 0, 0) for that computer model. It is better to define it where the model
touches the terrain database or in its center of gravity if it is an object
that might rotate around its center position.
Some models may be better off defining their origin at a forward or rear
corner coordinate so that every other location on that model can be described
by measuring in the horizontal plane (X and Y coordinates) and vertical
direction (Z coordinate) in positive measurement values. Some object model’s have appendages that need
to be defined relative to the base model’s origin and coordinate system. See the origin
labeling process again for the example of the leg’s origin definitions
being defined by where the base model is located over the terrain database
while the Simulation is running.
Appendages need to have the
origin of their own coordinate system (could be Polar if it rotates like an arm
or head) defined at the point where they are attached to the overall
model. The appendage’s description
should include how long the appendage is, what type of shape it is
(cylindrical, rectangular 3D stick shape, etc.) and whether or not it has an
attached additional appendage that extends the overall length of the total
appendage. An example would be an upper
arm is attached to a shoulder so the shoulder attachment point is the origin of
the upper arm. If there was a forearm,
then the forearm’s origin is the elbow and its length is described as how long
the forearm is until it comes to a wrist.
Then a hand’s origin is the forearm’s wrist and the hand extends out as
far as the hand is long. Each appendage
origin is actually the starting point of a translation vector that extends
outward along the center axis of the appendage its full length.
Assignment – Design an Object’s
Model for Placement on a CIG Simulation Terrain Database
This exercise is for the
student to make a few drawings of their object by hand on graph paper or in a
computer drawing tool and then add the appropriate labels as mentioned
below. In a real CIG company, this
drawing would be handed off to a model creator (software person) who would
enter the parameters mentioned on the drawing to build the actual set of
polygons representing that object in the CIG simulation database. See the example
drawing of an object with some labels.
Note that you may need additional labels mentioned below to complete the
assignment than are shown on this example drawing.
1. The student must select an object to model that is big enough for a person to see
and interact with physically (by touching, holding, climbing on, or going in
it).
2. The object
must be able to move (roll, walk, drive, fly, slide over) or change its
position, ( x, y, z ) location, in the environment. It must be an object that can move under its
own source of power so that an animation of it would make sense. In other words, don’t make inanimate objects
that are stuck to the ground in one spot such as a building unless the building
is on wheels and rolls around. An
example would be a vehicle (tank, car, flying machine) or a robot, animal,
bird, person, or creature that is living and able to move under normal
circumstances.
3. The
object must have at least one appendage that moves separately from the overall
base model’s movement across the land.
For example, the turret on the tank moves up, down, left and right
independent of the tank’s movement across the terrain. The appendage will be used to illustrate a
“translation” vector described in Drop-in 1.
4. The student
must draw several views of the object’s model. The required views are from the front and the
rear, from the top above the highest point of the model looking down and from
the sides (only need one side picture if the sides are identical). If it is appropriate, draw a view from
underneath the model. Also, if people
can go in the object, the student must also draw views from inside the object
(tank, aircraft) model such as where people are to be located and where the
computerized “windows” are located.
5. Once the overall shape of the object is
drawn, the student must label the
object’s overall length, height, and width beside the object’s drawing.
6. Then, the student must draw any appendages that attach to the object’s base model (center
body of the object) and define their
overall length, width and height.
This overall length will be the length of a “translation” vector (used
by simulation math routines) that starts at the appendage’s origin and extends
out along the appendage’s axis to reach its end at another joint or the end of
the appendage.
7. After the whole object is drawn, it is time
to label each appendage’s origin. A joint is where an appendage attaches itself
to the main model or to another appendage. The
joint is the origin of the attached appendage. An appendage should have recorded its origin,
its overall length and the “center position” vector of its “mobility” range (or
range of motion) that the appendage would normally point in.
8. The next part of defining the object’s model
is to establish its range of motion in
all directions. For example, a tank
cannot drive sideways but only forward or backward with some turning ability (a
turning radius). The appendages need to
have their limits of motion (or range of movement) defined so that they do not
exceed what is normal for that type of appendage. Also,
the appendages should have their range of movement angles and speed limitations
defined beside them on the object’s drawing. The information in Drop-in
2 may be useful when considering how rotational matrices use angles to
rotate an object and the angle rotations will probably have limits that need to
be specified on the object’s drawing.
9. The only other limitations for an object’s
model would be its structural strength
and whether it can hold up to a direct hit from enemy artillery or not. Then, when the simulation game is played, the
game playing routines will know whether they should leave the model alone or
make it look blown up when it receives a direct hit. Also, other types of attacks may cause other
features in the Simulator to stop working.
If the Simulator stops working due to a software error, then it can be
rebooted and re-enter the game. If the
Simulator stops working because it was fired upon and hit, then what has
happened is representing real life and that Simulator is finished playing that
simulation game.
10. Show your drawings to
your teacher and other students to see if they can understand them. If not, then simplify the object’s
description so that a real CIG computer graphics person could enter them into a
real CIG Simulation.
In summary, each object
should have defined, on graph paper, its own origin, its overall length, width,
and height measurements, its shape type (cylindrical tube, squared stick,
spherical ball, etc.), where its appendages are located (attached) relative to
the origin of the object’s base (body
center) model and how the appendages shall move during the Simulation.
How an object is used during the
Simulation
Many CAD/CAM object modeling
tools first draw the object in a wire-frame drawing tool. This wire-frame model needs to be converted
to a set of polygon points in the (x, y, z) format. The polygon processors crop the set of
partially visible polygons so that what remains is the part seen from the
selected viewpoint. Then, the polygon
processors apply color and texture to those prepared object’s polygons. The last step is to send the object’s cropped
and colored polygons to the computer screen “windows” in the Simulators.
An object’s movement can be
described or shown during the Simulation by using rotational matrices or Polar
angle rotations. Animation techniques
perform math routines that rotate an object about its axes or translate the
object to a different part of 3D space.
A “scenario” is a previously setup pattern of movement for an object or
set of objects. The object(s) may fly or
move through 3D space by following a selected set of data points represented by
a mathematical equation called a “spline”.

Visit the CIG Simulation Web
site below to download a CIG tank
simulation computer game demo below (Steel Beasts). Also, look at real world Digital Terrain Elevation Data for any where in the
world (and oceans too) under the Digital Terrain Elevation Data Web sites. The Army site has a CIG tank simulation used to
train soldiers in groups to prepare for real battle.
Computer Image Generator (CIG)
Simulation Web Sites
eSim Games – Steel Beasts – The company
eSim has made an Army tank simulation game called Steel Beasts which is a
simulator of the US M1A1 and German Leopard 2A4 tanks that let the players
create modern armored war scenarios and play them on their PCs. You can go to the game’s web site at
SteelBeasts.com from the left column choices.
The web page’s Download choice takes you to the page
http://www.esimgames.com/Downloads.htm which has a choice to download the Steel
Beasts Demo (20MB, 10/11/01) which takes about an hour and a half
(SBDemo1-195.zip) and save into a new folder you create called SBTemp. Then you run the setup.exe file in the folder
SBTemp. This is a computer game that
runs as a demo version with computer modeled tanks moving across simulated
terrain.
Date visited –
http://www.steelbeasts.com
eSimgames Company home page – Home page
for the eSim company, select “Play Games” to get to the “Steel Beasts” game.
http://www.esimgames.com
Computer Aided Design (CAD)/
Computer Aided Modeling (
BobCAD- CAM web site –Click
“Click here to Watch a Video” on creating a wire frame model for machining a
new object.
http://www.bobcadcam.com/index.php
BobCAD-
CAM steps to creating a tool – Shows you how to make a tool and illustrates
the object in a wire frame format.
http://www.bobcadcam.com/downloads/documentation/sample3cad/Sample3Lesson.htm
SURFCAM CAD/CAM Systems by
Surfware, Inc. – Company that created the JPL Mars Lander by making the
drawings and machining it.
http://www.surfware.com/PA-199712-jpl.htm
SURFCAM 2003 page – Shows
some nice photos of the drawings made in the CAD/CAM system.
http://www.surfware.com/prod-SC2003.htm
Wizard makes
hybrid CAD/CAM easy for shop – Article on computer CAD/CAM program capabilities.
http://www.manufacturingtalk.com/news/one/one100.html
Rhinoceros – NURBS modeling for Windows home
page – CAD/CAM company home page.
Select “Try Rhino” which brings up a download page where you can actually
try Rhino but cannot save it to your computer.
http://www.rhino3d.com/
The Rhino download page – The
download page to try Rhino’s CAD/CAM design tool demonstration version.
http://www.rhino3d.com/download.htm
Kellysearch for
CAD/CAM systems – List several companies that sell CAD/CAM services in the
United Kingdom.
http://www.kellysearch.com/gb-product-120021.html
Fort Knox, KY Army Training Center Home Page
- The
http://www.knox.army.mil/
Tank Driver Simulators at Ft.
Knox - This article is about how the
simulators caused some “simulator sickness” but they seem to have a solution.
http://www.ets-news.com/driverfatigue.htm
Training
Development at Fort Knox – The Fort’s training program page.
http://www.ott.navy.mil/view_detail.cfm?RID=WEB_OT_1000397&outside_flag=
Digital Terrain Elevation Data Sources
on the Web
The land data is displayed in colored maps with elevations represented by different colors. The actual data is elevation data (above or
below sea level) of a latitude and longitude pair (which defines its location
on the Earth).
NGDC Surface of the
Earth grid to select an area – You can select an area of the Earth and it
will show you a colorized map with elevation be noted by different colors. All of this data being displayed is from
elevation data that has been collected by satellite altimetry observations for
seafloor depths and by several means for collecting the topography or land data
such as normal surveyed data and satellite photography.
http://www.ngdc.noaa.gov/mgg/image/2minrelief.html
NGDC – Topography, Digital
Terrain Data – Lets you pick your state to see a digital map. First pick “The Global land One-kilometer
Base Elevation”, then pick “U.S. State Images” and then pick the state of your
choice. It brings up a colored map of
the state with the elevation data in colors by height above sea-level.
http://www.ngdc.noaa.gov/seg/topo/topo.shtml
National Geophysical Data
Center (NGDC) – Home Page - Lets you select “Get GLOBE Data” elevation data
in a one–km increment format. You can
even see the Earth’s oceans in colorful maps of their depths by picking the
“Smith/Sandwell” choice at the bottom of the page. There is an option to purchase data and
download it to your computer from the GEODAS choice.
http://www.ngdc.noaa.gov/seg/topo/globe.shtml
Bruce Gittings’ Digital Elevation
Data Catalogue – This is a home page where you can get to the catalog of
available terrain data, some for purchase and some are free.
http://www.geo.ed.ac.uk/home/ded.html
Land Processes Distributed
Active Archive Center home page – Select one of the grid areas on the map
and it will provide information on how to order that data or look at a drawing
of that area.
http://edcdaac.usgs.gov/gtopo30/gtopo30.asp
Land Processes
Documentation about Land Data – Documentation about the land data.
http://edcdaac.usgs.gov/gtopo30/README.asp#h1
Antarctic Land Mass
Image from Land Data – An example area of the Earth that was selected to
show a grid line drawing map over the Antarctic polar land mass.
http://edcdaac.usgs.gov/gtopo30/antart_tile_img.asp
Land Processes
Distributed Active Archive Center - Ask questions of the experts to find
out about digitized land.
http://edcdaac.usgs.gov/custhelp/help_home.asp
US Land Cover Digital Data
– Includes many types of data for the land covered including maps.
http://www.epa.gov/OWOW/watershed/landcover/