Carol Briggs
SLM 521
6/9/09
Web Drop-In #2: Earthquakes
We will continue the unit you’ve been working on in science about geology and plate tectonics. Today we will be looking at some real earthquake data from the US Geological Survey. We will be using this website: http://earthquake.usgs.gov/. First we will be looking at and interpreting a map, next we will be looking at some current earthquake information, and lastly we will be reflecting on what we’ve learned. Please look at the information and answer the questions below.
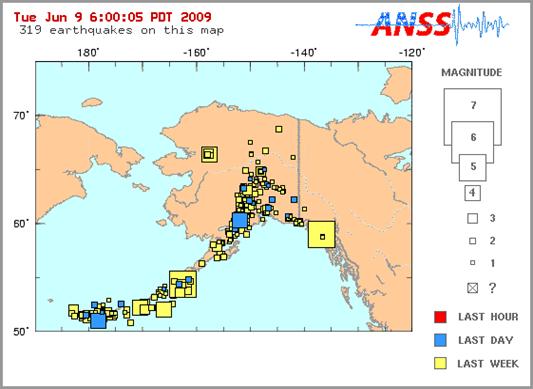
I.) First we will be looking at the map below that was created by the US Geological Survey.
a.) What do the different colored squares mean? Explain what is indicated by the red, blue, and yellow squares.
b.) What do the different size squares mean? A bigger square means what? A smaller square means what?
II.) Next, go to this link: http://earthquake.usgs.gov/eqcenter/. We will be looking at some current earthquake information.
a.) Click on the link to find current earthquakes from around the world. Where was the most recent earthquake? How strong was it?
b.) Do you see places on the list in the world that tend to have more earthquakes? Which places come up on the list frequently?
c.) Now click on the link to find the earthquake data from around the United States. Where was the most recent earthquake? How strong was it?
d.) Do you see places in the United States that tend to have more earthquakes? Which places do you see on the list frequently?
III.) Learning what we have learned in our unit on geology and plate tectonics, reflect on: a.) Why earthquakes tend to happen more often in certain places. b.) When you looked at the current earthquake data were you surprised how many earthquakes there are everyday? Or, was it what you expected?